Fleet utilization rate is calculated by dividing active operating hours by total available hours, then multiplying by 100. A forklift that runs 6 hours out of an available 8-hour shift has a 75% utilization rate. The formula itself is simple. Getting an accurate number for every unit in a growing fleet, instead of one fleet-wide average, is the harder part.
Core Metrics
- Utilization Rate: the percentage of available time a piece of equipment spends actively working, calculated as productive hours divided by scheduled or available hours.
- Idle Time: time a unit is powered on and available but not performing productive work, distinct from scheduled downtime.
- Downtime: time a unit is fully out of service for repair, maintenance, or lack of an operator, and cannot be counted toward available hours at all.
Key Takeaways
- Utilization rate = (active operating hours / total available hours) x 100.
- 15-20% of the average fleet sits underutilized at any given time, each idle unit costing $8,000 to $15,000 a year.
- Measuring utilization manually, pulling odometer or hour-meter readings by hand, takes hours each month and still misses which specific units are dragging the average down.
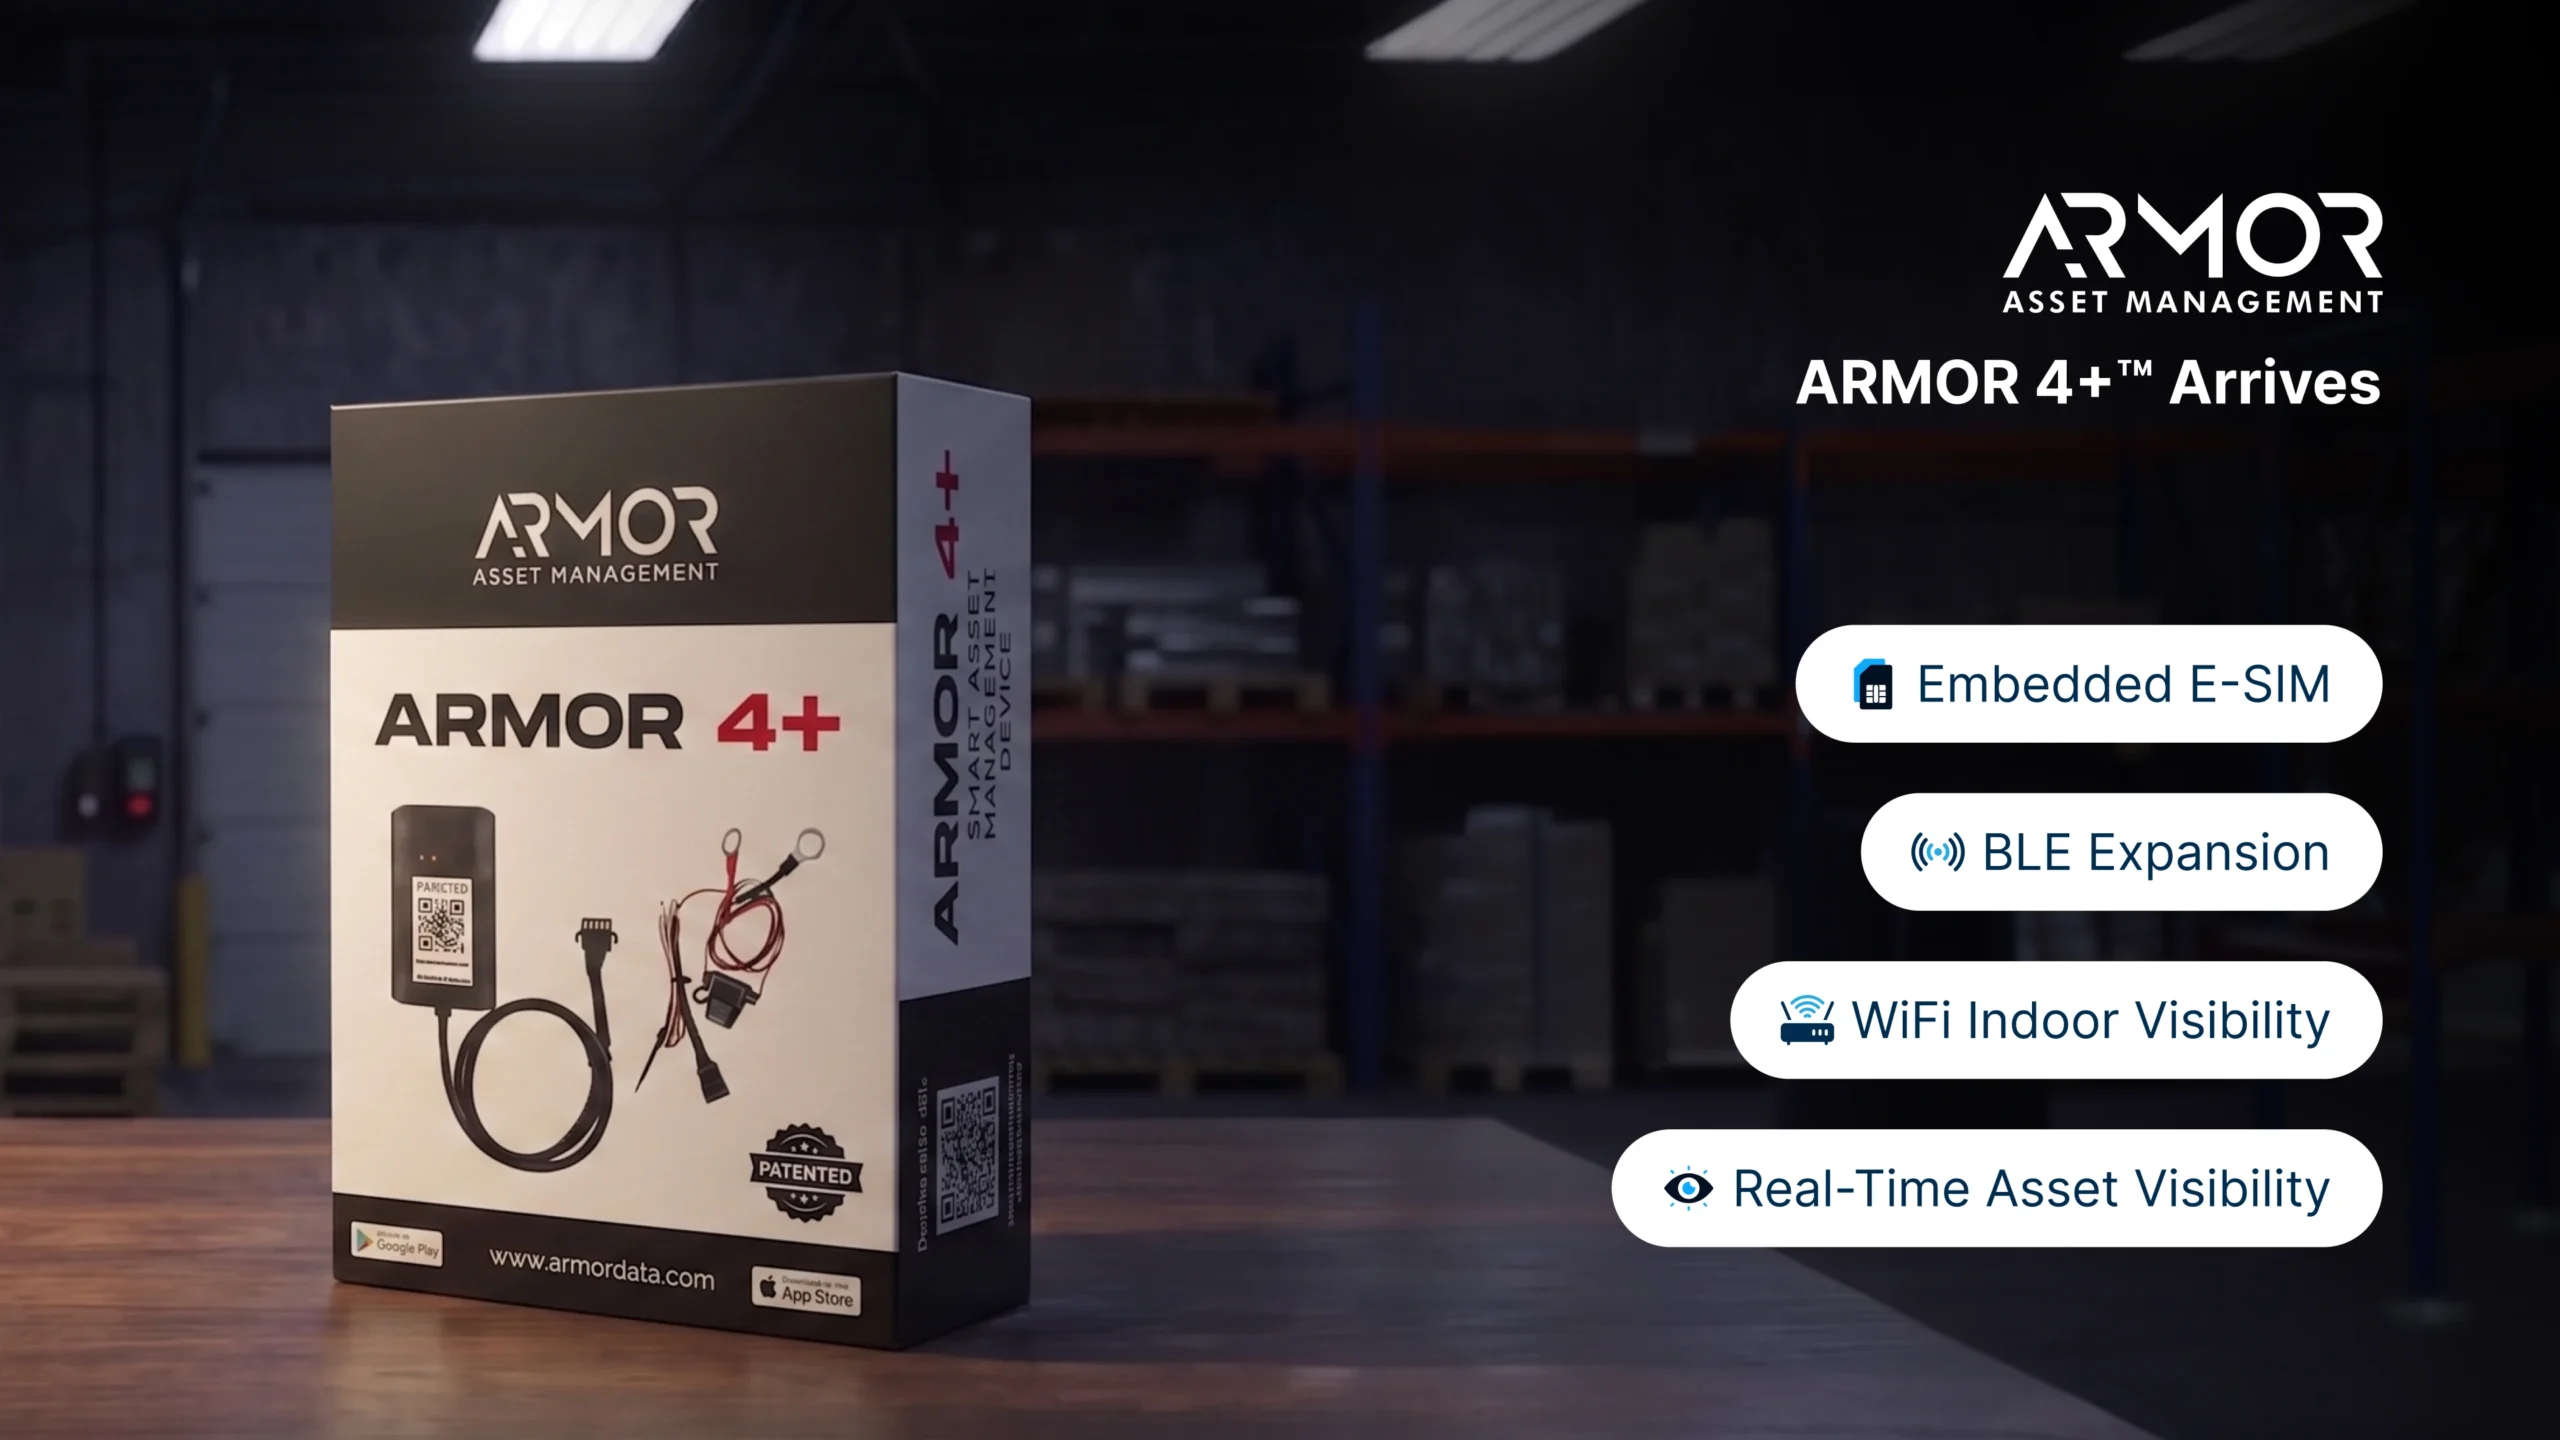
- ARMOR 4+™ reports runtime hours directly from each asset, giving fleet-wide utilization a real-time, unit-level view instead of a monthly manual estimate.
Why the Formula Alone Is Not Enough
The math has never been the hard part. Two machines running at 75% utilization can match the output of three machines running at 50%, so a fleet carrying enough underutilized units may be able to shed one without losing productivity. The real difficulty is getting that number accurately for every unit as a fleet grows, not a rough average that hides which specific machines are the problem.
For target ranges by equipment type and what a good rate actually looks like, see our fleet utilization benchmarks guide.
Why a Fleet-Wide Average Hides the Real Problem
A single utilization percentage for an entire fleet feels like useful information. It usually is not. A fleet averaging 62% utilization sounds reasonable until a deeper look shows three specific units have not exceeded 40% in six months. The average hides exactly the units a manager needs to act on, and those units still cost $8,000 to $15,000 a year each whether anyone notices or not (2026 industry data).
Why Manual Measurement Fails as a Fleet Grows
Pulling odometer or hour-meter readings by hand, entering them into a spreadsheet, and calculating utilization manually can take hours every month, and the result is still a lagging, fleet-wide average rather than a real-time, per-unit view. By the time a quarterly review surfaces a chronically underused unit, months of carrying cost have already been spent on it.
ARMOR 4+™ removes the manual step by reporting runtime hours directly from the asset itself. That data feeds ARMOR Asset Central™, the system of record for physical assets, giving a fleet-wide utilization view that updates continuously and shows which specific units are underused, not just what the average looks like.
Best Practices for Measuring Utilization as You Scale
- Connect every unit, not a sample. ARMOR 4+™ bolts onto any battery-powered or engine-powered equipment and reports runtime hours, voltage, GPS location, and impact events automatically, so utilization data exists for the whole fleet, not just the units someone remembered to check.
- Centralize the data in one system. ARMOR Asset Central™ consolidates runtime data from every connected unit into a single dashboard, replacing the separate spreadsheets and site-level logs that make fleet-wide comparison difficult.
- Set a baseline per equipment type. A forklift and a golf cart do not share the same healthy utilization range. Establish a target for each equipment category rather than applying one fleet-wide number to everything.
- Audit against the record regularly. Compare reported runtime against expected job or schedule logs periodically to catch units drifting toward the underutilized range before a quarterly review does it for you.
What This Looks Like in Practice
A facilities team running a growing mixed fleet stops relying on a monthly manual utilization estimate. ARMOR 4+™ runtime data surfaces three specific forklifts running well below the healthy threshold for consecutive months, units that would have stayed hidden inside a fleet-wide average. Those units get redeployed to a busier site instead of sitting idle, and the fleet avoids an unnecessary new equipment purchase that the average utilization number alone would never have flagged.
Frequently Asked Questions
What counts as a healthy equipment utilization rate?
It varies by equipment type and fleet mix. See our fleet utilization benchmarks guide for target ranges and how to spot units that are chronic underperformers.
How much does underutilized equipment actually cost?
An estimated $8,000 to $15,000 a year per unit, and on a 100-unit fleet, underutilization can drain $120,000 to $300,000 annually.
Why does manual utilization measurement miss the real problem?
Manual methods produce a fleet-wide average, which can look acceptable even while several specific units sit well below a healthy threshold for months at a time.
How does ARMOR™ improve utilization measurement?
ARMOR 4+™ reports runtime hours directly from each asset in real time, and ARMOR Asset Central™ surfaces which specific units are underused, not just a fleet-wide average.
Want to see which units in your fleet are actually underused? Explore ARMOR 4+™ or talk to our team about connecting your fleet.