A healthy fleet utilization rate is around 70%, with top-performing fleets using telematics and AI-assisted dispatch reaching 75-85%. Heavy trucking fleets benchmark higher, at 85% or better. Most fleets fall well short of this. The average fleet has 15-20% of its equipment sitting idle at any given time, quietly draining $120,000 to $300,000 a year on a 100-unit fleet.
Key Takeaways
- A healthy fleet runs at roughly 70% utilization. Top performers using telematics and AI-driven dispatch reach 75-85%.
- 15-20% of the average fleet sits underutilized at any given time, each unit costing $8,000 to $15,000 a year just to own.
- Idle time in large construction fleets runs 28-30% on average, and as high as 38% in some North American fleets.
- Right-sizing a fleet is a top strategic priority for 2026, driven by rising capital costs and better data availability.
What Is a Good Fleet Utilization Rate in 2026?
The industry benchmark for a healthy fleet sits around 70% utilization, leaving room for maintenance, repairs, and demand swings (2026 industry data). High-performing fleets running strong telematics and AI-assisted dispatch push that figure to 75-85%.
For heavy trucking specifically, 2026 productivity benchmarks point to 85% or better as the mark of a top-performing mixed fleet (2026 industry data). A fleet-wide average can still hide a lot underneath it, though. An 85% average can mask individual units running at 40% or worse while quietly consuming fixed costs.
Want the exact math behind that number? See how to calculate your fleet’s utilization rate unit by unit, not just as a fleet-wide average.
How Much Does Underutilized Equipment Actually Cost?
More than most fleet managers realize until they measure it. 15-20% of the average fleet sits idle at any given time, and each unit costs $8,000 to $15,000 a year in depreciation, insurance, registration, and maintenance, whether it moves or not (2026 industry data). On a 100-vehicle fleet, that is $120,000 to $300,000 a year draining out for equipment contributing nothing to operations.
Most fleet managers do not know their real utilization rate, because they have never measured it systematically (2026 industry data). They sense that some units sit parked more than they should. Without data, they cannot say which ones to cut without risking service disruptions.
Idle time compounds the problem. Large construction fleets average 28-30% idle time, and some North American fleets run as high as 38% (2026 industry data). One equipment manager who started tracking idle time and utilization in 2025 estimated $15,000 to $19,000 in monthly savings from reduced fuel waste, idle time, and depreciation alone (2026 industry data).
Why Does Utilization Data Matter More in 2026?
Fleet right-sizing has moved from a nice-to-have to a top strategic priority for 2026, driven by rising capital costs, tighter budgets, and better data availability through telematics (2026 industry data). Buying out of a capacity problem used to be the default answer. That is a harder case to make when capital costs more and the data shows idle capacity sitting in the yard already.
There is also a billing angle worth catching. A customer might rent equipment for a single eight-hour shift but actually run it sixteen hours. Tracking engine hours remotely lets an operator bill for that overage, improving financial utilization per asset without adding a single unit to the fleet (2026 industry data).
What Is the Fastest Way to Improve Fleet Utilization and Turn It Into Revenue?
Most utilization gains come from closing visibility gaps rather than buying new assets:
- Find the ghost assets first. A ghost asset is equipment on the books that cannot generate revenue because its location or status is unknown. In manually tracked fleets, machines commonly sit idle for days after being returned before anyone notices they are available (2026 industry data).
- Unify data across a mixed fleet. Logging into five different OEM portals for five different brands to calculate utilization is not practical at scale. Standardizing that data into one dashboard is often the single biggest unlock.
- Cut dispatch lead time. A pre-trip inspection delay can shave roughly 18 minutes off daily availability per unit, and manual dispatch boards routinely lose hours hunting for the next available vehicle (2026 industry data).
- Target idle time specifically. Industry leaders aim for idle time under 5%, since a heavy-duty truck burns roughly a gallon of fuel per hour just sitting still (2026 industry data).
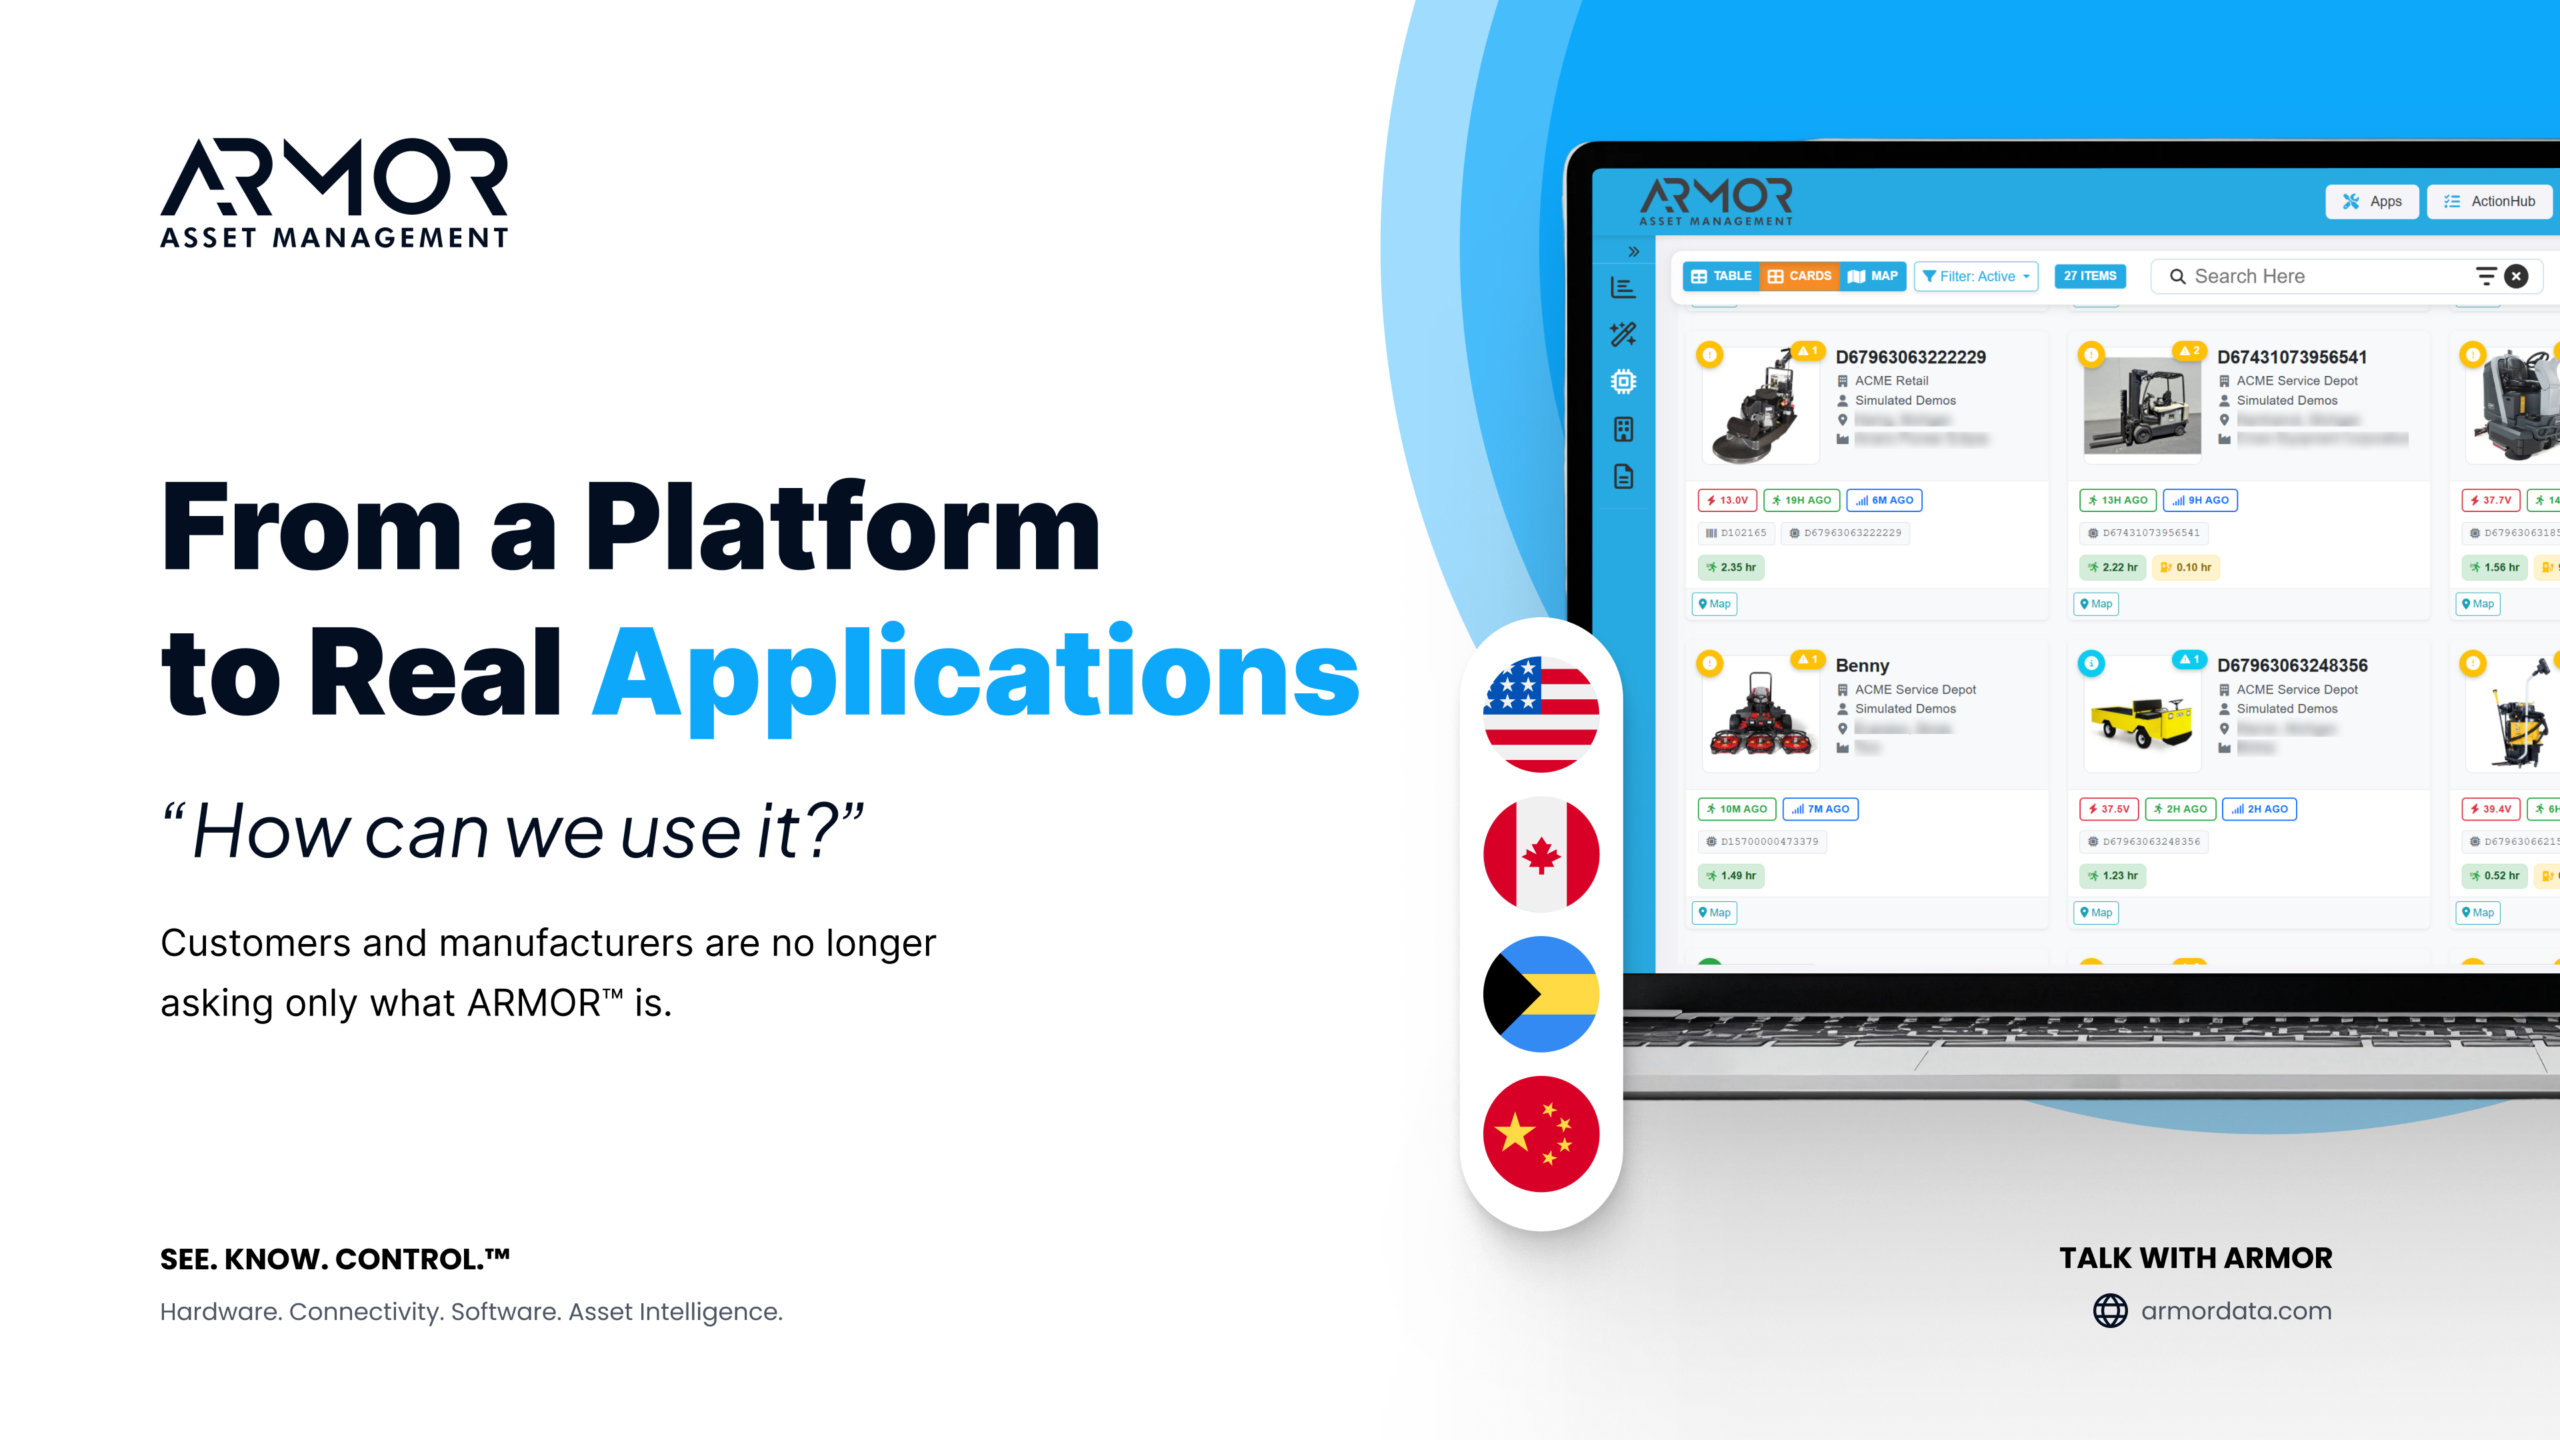
ARMOR™ pulls mixed-fleet data from multiple manufacturers into a single utilization view, so an enterprise asset management team can run one report instead of five and see exactly which units are earning their keep.
Frequently Asked Questions
What utilization rate should trigger a fleet right-sizing conversation?
Below 60% utilization combined with idle time above 20% usually signals a demand problem rather than a scheduling one, pointing toward redeploying, pooling, or divesting underused assets rather than tightening dispatch.
Does telematics pay for itself on a small fleet?
Often yes. Telematics typically cuts fuel consumption by 10-15% within the first year, and idling alone wastes roughly $3,500 to $4,500 per vehicle annually in a typical service fleet, covering the cost of most telematics programs quickly.
How do you calculate utilization across a mixed-OEM fleet?
Standardize on a shared framework like AEMP so engine hours, location, and status data from different manufacturers can be compared on equal terms, rather than manually reconciling numbers from separate OEM portals. For the step-by-step formula, see how to calculate fleet utilization rate.
Is fleet utilization the same thing as fleet efficiency?
Related but not identical. Utilization measures how much of your capacity gets used. Efficiency measures how well that used capacity performs, covering fuel economy, route optimization, and empty-mile reduction.
Explore ARMOR™ Solutions
- About ARMOR™: learn more about the platform standardizing intake across mixed equipment fleets. Contact Us.
- Asset Central: the unified dashboard for tracking equipment health across sites.
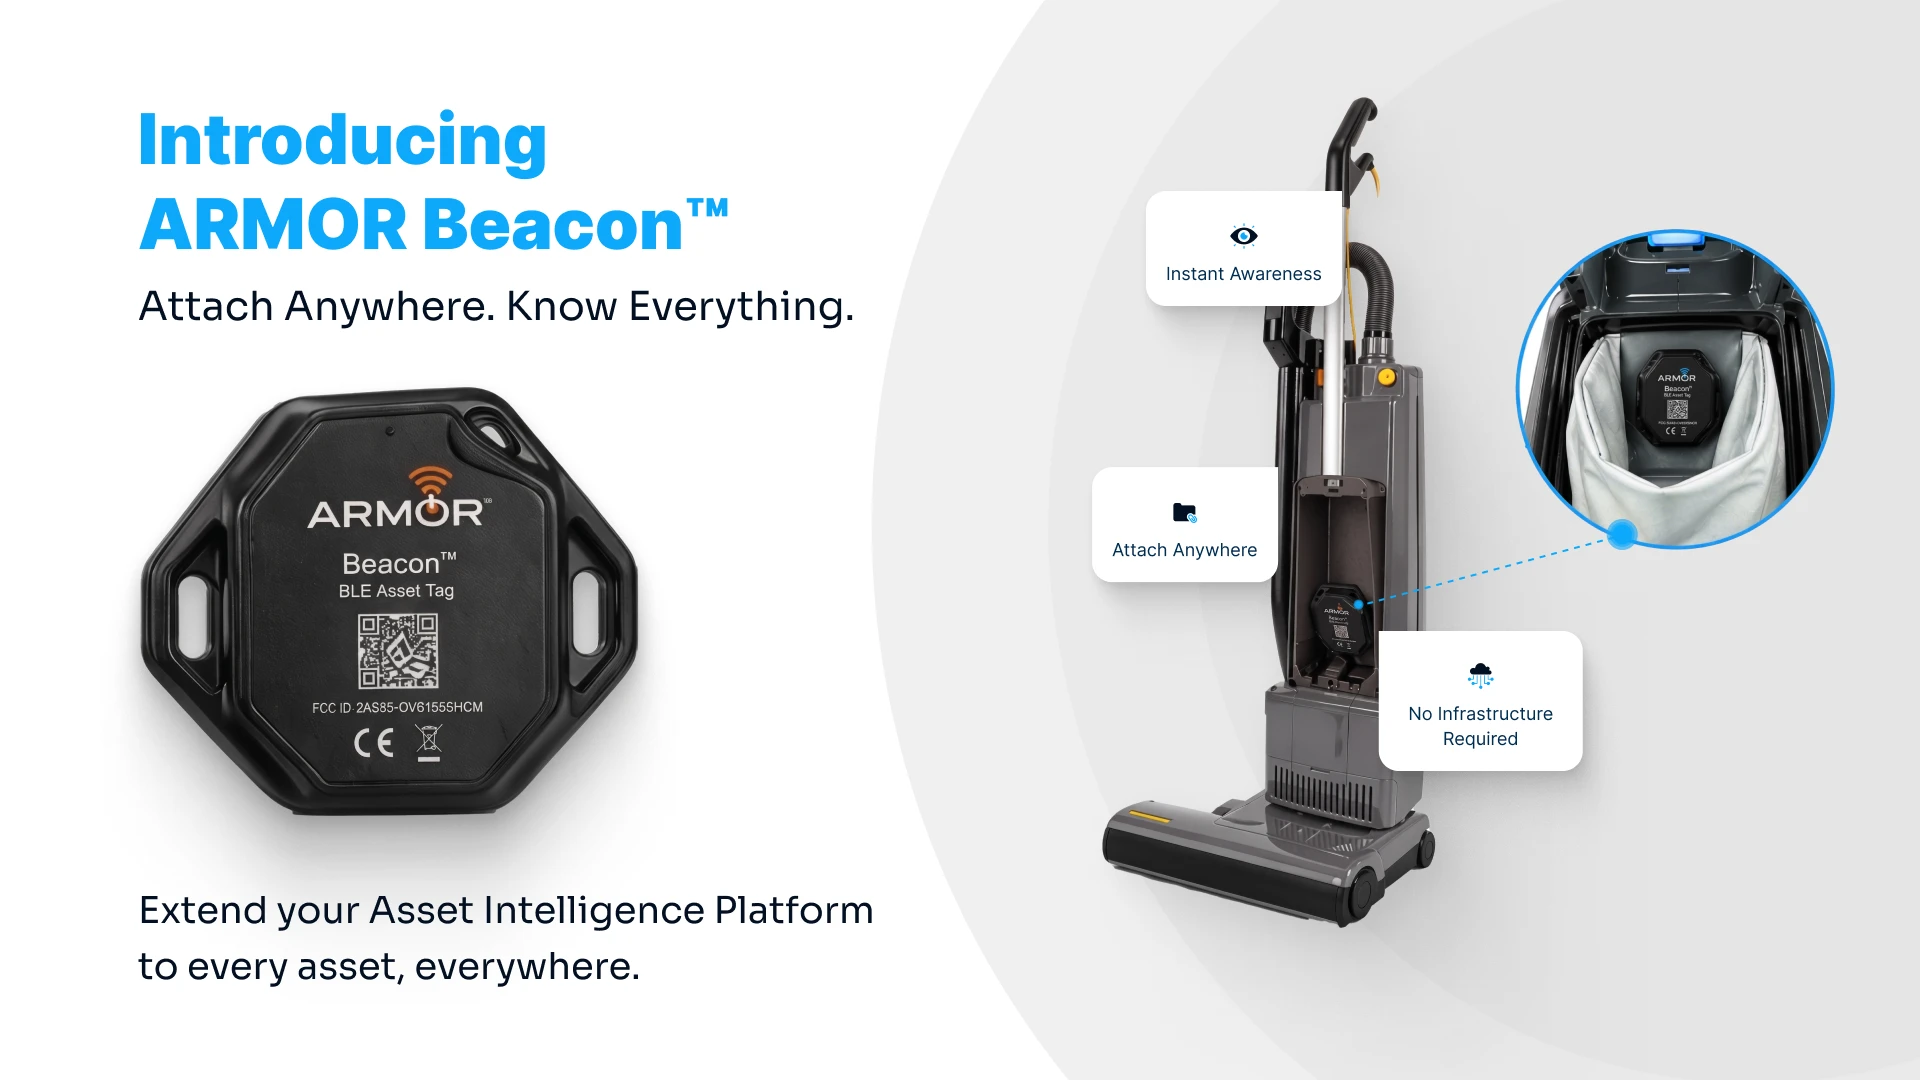
- Beacon: edge-level alerting for time-sensitive signals.
- Track: asset-level monitoring built for predictive maintenance.